Understanding EPS Definition and How to Apply EPS in Practice
In this Article:
- Quick EPS Definition
- Different types of EPS calculations with examples
- Where to find EPS information
- How to use EPS in practice
What is EPS?
In Short:
Earnings Per Share (EPS) is the result of taking the net income of a company and dividing it by the available shares, these numbers can be found on the income statement and balance sheet for the period. The number you get from doing this calculation is often looked at as an indicator of profitability. Yet, this is a groundwork definition that serves to outline the underlying concept. In reality, there are two main versions of this formula that investors use, they are basic EPS and diluted EPS.
Basic EPS:
In-depth:
Basic EPS is when potential new shares are not added to the EPS calculation, what is there today is what you use. This means that if a company has 1 million new shares that could become common within the near future they are not accounted for in this calculation.
To calculate basic EPS for a company, the company’s net income is divided by the total number of outstanding common shares. This means preferred stock dividends have been taken out of the net income.
Example calculation 1: Say a video streaming company has a net income of $250 million, no preferred stock, and a total num
Example calculation 2: Say the video streaming company had preferred stock of 50 million shares whose dividend entitlement was $50 million. The calculation would then be the net income of $250 million minus $50 million preferred dividend entitlement which leaves $200 million for the 300 million common shares outstanding. The result would be a basic EPS of $0.67/share

Where to find EPS information:
Already calculated earnings-per-share can easily be found on many online stock data sites, we’ve included a list of a few sites below.
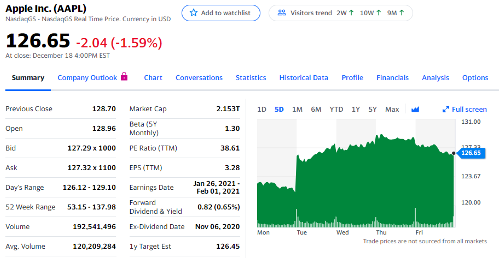
Simply visit one of these sites, enter a stock quote then look for “summary”, “key statistics” or something to that effect. You should see “EPS” or “EPS (ttm)”. The “(ttm)” means trailing twelve months, this indicates that the figure was calculated to include the most recent quarterly data.
Not sure on “ttm”? -> an eps (ttm) of 6.02 means that over the last twelve months 1 share of that company has earned an equivalent of $6.02 in net income. However, if you own 1 share of the company this does not mean you get $6.02 because the company has the right to retain earnings for future investment. What you as an owner get of this $6.02 is called a dividend, you can learn more about dividends by visiting our article on them.
Calculate EPS yourself this is a bit more tricky, to do this you will need to look up a company’s 10-k (annual statement) and/or its 10-Q (quarterly statement). Getting access to this information on publicly traded companies is easy, simply visit EDGAR: https://www.sec.gov/edgar/searchedgar/companysearch.html. This site is run by the Securities and Exchange Commission (SEC), you can enter the company you want to know and it will pull all the statements.
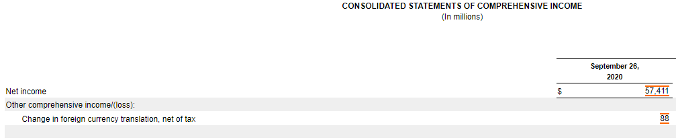
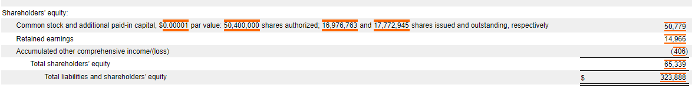
Next, you will need to find the number of common stock outstanding and net income. Common stock outstanding can be found on the bottom of the balance sheet. While net income can be found on the income statement (this may be called something different like “consolidated statements of Income”)
Using EPS in practice:
In practice:
When it comes to actually looking at companies you might want to invest in, understanding EPS is important as many other relative valuation metrics are built off it, like the P/E Ratio. Knowing the EPS of Ford vs GM can help you understand which one might be “cheaper” in a comparison between the two (in that comparison alone). These two companies are similar and competing in the same market segment, this is an area that you could properly apply an EPS comparison. Where you probably wouldn’t want to use an EPS comparison is between say Ford and Microsoft. These companies are not similar and do not compete in the same market segment. In different market segments, companies operate differently, as such expectations for them are and should be different. For example, generally, the amount of capital required for producing dollar-equivalent software is lower than the amount of capital required for an industrial business like car manufacturing as well as their expected return.
Next, using just one metric to find or justify an investment normally isn’t the best way to go about it. As mentioned earlier, EPS is a building block for many relative valuation metrics that when used together and in proper comparisons can help you build a more robust data-driven view of a company. Knowing the average P/E, PEG, and Price/Sales in say the semi-conductor sector can help you find outlier companies and start asking questions of why is their P/E so high or low?
Finally, it’s important to understand numbers but it is also important to understand the companies you are looking at. What do they do? What problem are they solving? Whose their leadership and where do they want to take this company? Sometimes numbers seem really high for a company because investors believe in the potential of the company.
Learn about Trailing and Forward EPS here: https://speckandcompany.com/what-is-a-good-pe-ratio/