What is a Good P/E Ratio?
Using P/E to find overvalued or undervalued investments
Good P/E Ratio
In short:
The best answer to “what is a good P/E ratio” is, unfortunately “it depends”. Why? Because the P/E ratio is a relative valuation tool that only provides insights when used in a proper comparison of companies. Saying a good P/E ratio is 15 then using that against tech companies would not be of any value other than maybe leading you to invest in suboptimal companies.
Without going into depth, to find a “good P/E ratio” you may want to first identify a market sector of interest. Let’s say you are interested in the Technology sector broadly speaking. You would then search for the average P/E ratio for the technology sector and use it as a comparison against other companies you are looking at. If a company of interest has a lower P/E than the average this might mean it is undervalued or it could indicate there is an underlying reason for the company trading under the average. This is the point that you would have to look at more than just the P/E ratio.
A Good Place to Start
In-depth:
Since the P/E ratio is a relative value tool used in comparison, an investor may want to know what the market as a whole is trading at. This can easily be done by looking at stock data providing websites. The Wall Street Journal offers index P/E ratios which can help decide what a good P/E ratio looks like.
To get this information visit: https://www.wsj.com/market-data/stocks/peyields where you’ll find this page below.
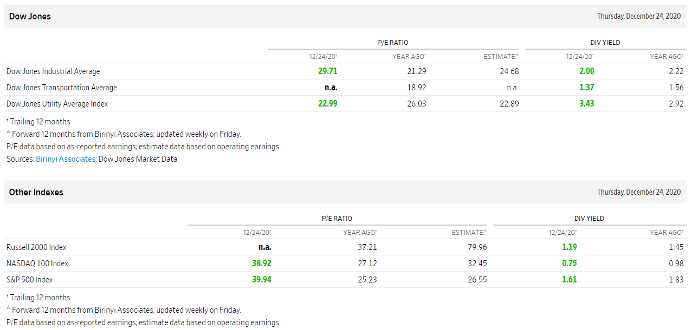
From here you can look at multiple index P/E ratios, this will be a helpful starting place in establishing a good P/E ratio. For example, say you were looking for the P/E of the market as a whole, you would want to use the P/E ratio for the S&P 500. This is because the S&P 500 is the most commonly used index when referring to the stock market as a whole.
What is the P/E Ratio?
In short: The P/E ratio of a given company relates the going price per share to its earnings per share to create a metric that can be used in relative valuation. This ratio gives a quick way to begin evaluating a company but only when it is compared to like type companies or to itself at different points in time. The calculation is simply done by dividing the current share price by the earnings per share.

In-depth: There are commonly two flavors for the P/E ratio, one is trailing P/E and the other forward P/E. Both are an attempt to figure out the valuation for a company, that is whether or not the company is overvalued, valued fairly, or undervalued. The difference between the two lies in which earnings per share is used.
Trailing P/E
The trailing P/E is a gauge of what investors are willing to pay for a share given the company’s past performance. This is because the earnings per share used to calculate trailing P/E is the eps for the past twelve months, called the trailing twelve and denoted “(ttm)”. What should be noted is that companies only report earnings on a quarterly basis so it is possible to have some lag in this figure. One reason an investor may prefer the trailing P/E is that it is based on actual earnings, these earnings have taken place and are not subject to someone’s estimation. Using actual earnings rather than expected earnings removes much of the risk of error and potentially making decisions off inaccurate numbers.

Forward P/E
Knowing what the company is valued at for what it has done in the past is valuable, however, what a company has done in the past is not as important to an investor as what it will do in the future. To accommodate for this some investors prefer to use the Forward P/E which is based on expected earnings called guidance.
Guidance is issued by companies or analysts detailing what they reasonably expect to earn going forward. Investors can then take this information and use it to calculate the forward P/E to help them decide what they are willing to pay to invest. The potential problem with using guidance to calculate Forward P/E comes in them either with the unknown risk of future events and the possibility companies over or understate their future earnings. A company with a Forward P/E of say 25 could quickly go to a P/E of 35 or higher if an unforeseen event happens or the company did a bad job at estimating their earnings.

Additional resources: What is the PEG Ratio?