The spread of returns or multiple assets
In short:
Portfolio variance is a statistical measure of the spread of returns in a portfolio, which, in investing is used as a measurement of risk and an important part of modern portfolio theory. On its own, portfolio variance is difficult to interpret but its square root (the standard deviation) is not.
Put simply, portfolio variance is the calculation of the variance of many independent assets acting as one.
Key Points
- Portfolio variance is a statistical measure of the spread of returns in a portfolio.
- To calculate portfolio variance you need each asset’s weight in the portfolio, their individual variance, and the covariance between the other assets.
- The square root of the portfolio variance results in the standard deviation which is more easily used by investors or analyst
In-depth:
What is Portfolio Variance
With the standard idea of variance, you are calculating the spread of the data points for an individual variable (or asset). Used in the context of an individual stock, for example, an investor could calculate the variance of a stock’s price to get a sense of the price volatility for that stock.
Likely, the investor would, after calculating the variance, take its square root to calculate the standard deviation. To keep it simple, the standard deviation might say something like $10, meaning the stock may vary $10 on average from the trendline price.
We can extend this idea of variance to portfolio variance. Instead of measuring the variance of just one asset or stock moving alone, we measure the effect of multiple independent stocks acting together in a portfolio.
As a result, we must use a formula that takes into account each asset’s weight in the portfolio, their individual variances, and the covariances between the assets in the portfolio. What we come up with by doing this is the variance for the entire portfolio which we can then assess using a similar process as we did for an individual stock.
Namely, we would ideally take the square root (standard deviation) of the portfolio variance and end up with a number or percent, i.e. 11%. If we end with 11% for example, we could interpret this as our portfolio may vary by 11%.
Calculating Portfolio Variance – Example
Calculating portfolio variance is different from calculating “normal” variance since we are looking at the riskiness of not just one asset but multiple assets that may have opposite effects on the portfolio. As a result, we have two different general formulas we can use to compute portfolio variance.
Formula:
The twist on the version of the formula above is to rearrange the covariance variable to be expressed as the correlation of the two stocks multiplied by their standard deviations. The reason we can do this is that correlation is the covariance of the two assets divided by their standard deviations.
Extending to standard deviation
When we apply either of these formulas the result will be the variance for a two-asset portfolio. However, portfolio variance on its own isn’t really instructive. To compute a usable statistic we can take the root of this value which will yield the standard deviation.
Example Calculation
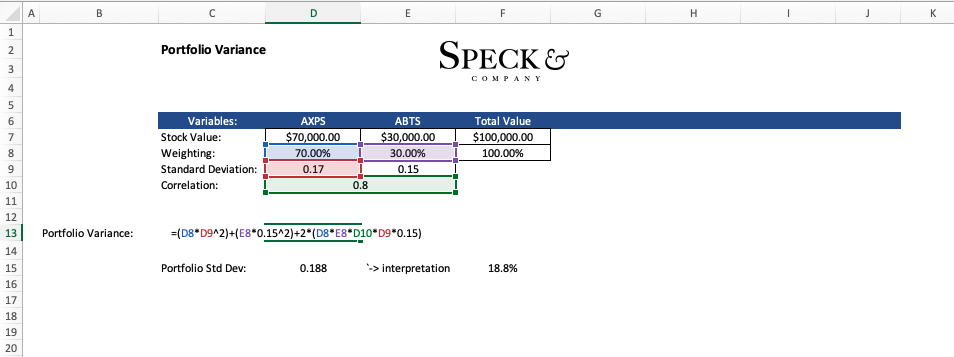
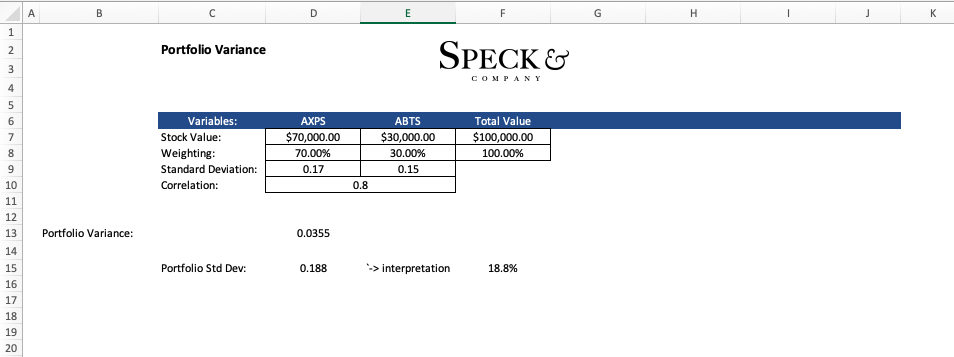
Let’s say we have a simple portfolio of only two stocks AXPS and ABTS. In our portfolio AXPS accounts for 70% and ABTS accounts for the other 30%. In addition to this, we know that the standard deviation of ABTS is .15 and the standard deviation of AXPS is .17 with their correlation being .8 or 80%.
At this point, we have enough information to calculate the portfolio variance as follows.
Portfolio variance = (.7 x .172) + (.3 x.152) + 2(.7 x .3 x .8 x .17 x .15) = .0355
From here we can calculate the standard deviation to get a more usable value.
Portfolio standard deviation = (.0355)^1/2 = .188 or 18.8%
Calculating Portfolio Variance in Excel
While knowing how to calculate portfolio variance by hand could be valuable to understand the mechanics behind the formula. Calculating portfolio variance by hand is not practical and should not be done as it is tedious and susceptible to human error.
An alternative is to calculate portfolio variance in excel.

The result of applying the formula in excel will yield the same value “.0355” from which we can calculate the standard deviation to interpret.

The result of using excel is automating the calculation for us which will become more useful as we need to add more assets to our portfolio.