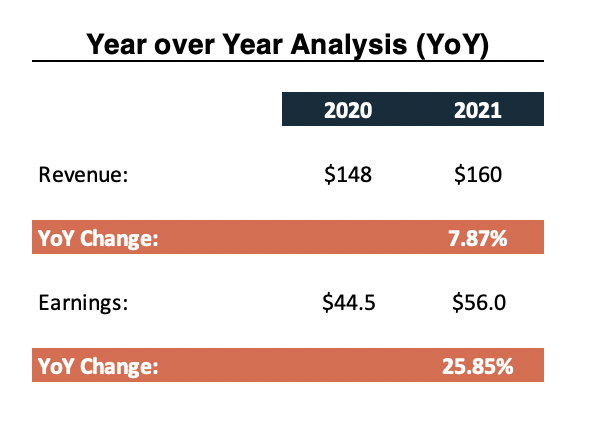
Annual apples to apples comparison
In short:
Year over year (YoY) is a financial comparison metric used to compare performance from one time period such as a week, month, or quarter with the same week, month, or quarter in a different time. For example, an investor may compare the sales figures of a company in June of one year against the sales figures of the same company in June of a different year.
By comparing financial performance during the same time period in different years, investors can get a true “apples to apples” comparison of if a company is improving.

Key Points:
- YoY compares performance from two or more identical time periods (weeks, months, etc.) in different years.
- YoY analysis allows an investor an “apples to apples” comparison adjusted for seasonality.
- Another similar metric to YoY analysis is year to date (YTD) analysis which shows a company’s performance since Jan. 1st.
In-Depth:
Using YoY
When it comes to comparing a company’s financial performance now to its financial performance in the past, YoY is an excellent starting point for an investor. YoY comparisons allow an investor to track a company’s financial metrics over time and adjusted for seasonality.
Seasonality roughly stated, is the rise and fall of demand for a company’s products and services throughout the course of a year. Many industries experience seasonality, take retail stores for example which typically see the greatest demand (and therefore revenue) during the Christmas season.
Using YoY analysis, investors have a way of parsing out points throughout the year that they can compare with the same point in years prior. In doing so, this type of comparison can mitigate the effects of seasonality which otherwise could skew an investor’s analysis.
For example, if an investor looking at a retail store compared its financial performance during the Christmas season one year to its financial performance during late summer in another year, this would be a poor comparison. Likely, the company would look like its underperforming in the year using the late summer values, however, in reality, the problem is the comparison. Using a YoY comparison would resolve this issue and yield more accurate results.
Calculating YoY
So how exactly do you make a YoY comparison calculation-wise? The first thing we need to do is identify the time periods within a year we want to compare. For example, below we are comparing different quarters throughout the year to the same quarter in another year.
Once we know the time period we take the most current period, divide it by the previous period, then subtract 1. This will result in the percentage change from one time period to another.
Applying this to our example below, we can take the revenue in Q1 – Yr 2 divide it by Q1 and subtract 1.
Ex. ( $36 / $31 ) – 1 = 16.13%
