What is the PEG Ratio
The PEG Ratio takes a company’s P/E ratio and adds in the expected earnings growth.
In short:
The PEG Ratio for a given company takes the current price to earnings ratio for that company and factors in an expected earnings growth rate. This factoring of growth rate by the PEG ratio allows investors to create another metric in relative valuation of comparable companies. To calculate the PEG ratio, the price-to-earnings (P/E ratio) of a company is divided by the expected earnings growth rate over a period of time.
FORMULA:
In-depth:
The PEG ratio provides a useful variation of the P/E ratio for investors to use when examining companies. While the P/E ratio allows an investor to get an understanding of what they are paying for earnings today or slightly into the future a major aspect is left out, earnings growth. Without taking earnings growth into consideration an investor may look at a company with a higher P/E in comparison as overvalued. However, it could be very possible that the company which appears overvalued has a much higher earnings growth expectation, therefore, other investors are willing to pay what appears to be a premium today yet in actuality could very well be a deal.
Basic Example
Looking at a basic example we can begin to see the value the peg ratio may offer an investor. Say we are comparing two similar companies, that is, they are in the same industry and of similar size. Company A has a P/E of 45 and Company B has a P/E of 35 while the industry average P/E is only 30. However, we are able to find out that the expected earnings growth of Company A over the next year is 30% whereas the expected earnings growth for Company B is only 20% for the same timeframe. From here we can calculate the PEG ratio for both:
Company A
PEG Ratio = 45 / 30
PEG Ratio = 1.5
Company B
PEG Ratio = 35 / 20
PEG Ratio = 1.75
(Division is done without using percent in decimal form)
After calculating the ratio for both companies we can see that even though Company A initially looked more expensive than Company B from just P/E alone but in reality that is not the case. Company A actually is the better deal as an investor can buy future earnings at a discount as earnings growth is factored in.
Considerations
Factoring in earnings growth via the PEG ratio is a powerful tool for an investor but not without its drawbacks. The main point of the PEG ratio, which is factoring in earnings growth, also turns out to be its biggest weakness. This is because earnings growth are estimates and can vary greatly depending on who is calculating them for a company and how they view the company. Ultimately, a pessimistic or optimistic view of a company will spill into expectations on earnings which could heavily impact the ratio. For this reason, it is extremely important for an investor to know who is calculating the expected earnings if they are not themselves and if the analyst calculating expected earnings has a similar view of the company as the investor does.
Using the basic example from above, say the analyst was only slightly more pessimistic about Company A and had an earnings expectation of 25% instead of 30%. When the ratio is recalculated the result is 1.8, which is slightly higher than that of Company B. As a result the investor may believe Company B is a better investment while this may not actually be the case.
Where to find PEG Ratio information
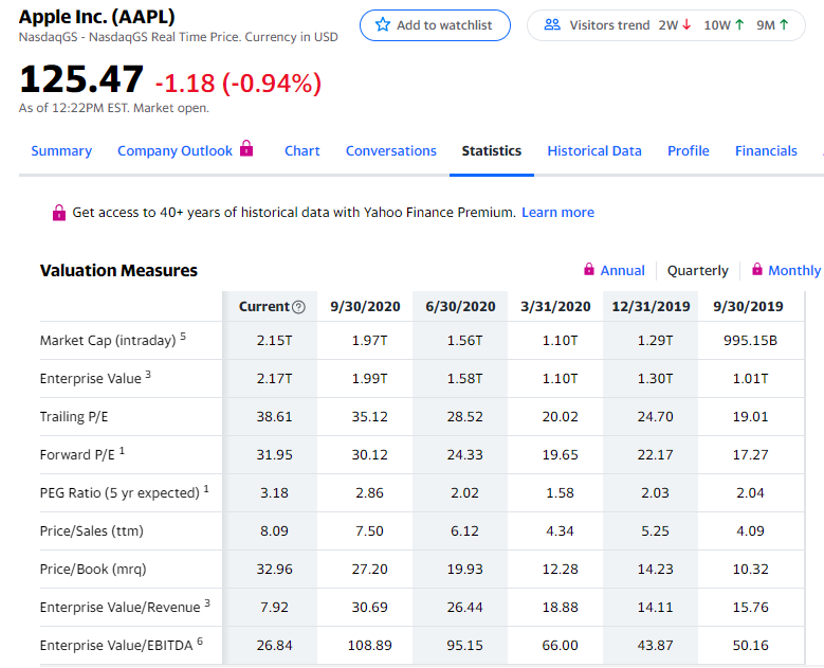
Already calculated This can easily be found on many online stock data sites, we’ve included a list of a few sites below.

Simply visit one of these sites, enter a stock quote then look for “statistics”, “key statistics” or something to that effect. You should see “PEG Ratio”. It is important to note the timeframe being used in the already done-for-you calculation as well as the considerations mentioned above, making sure the estimated earnings growth is in line with their own views of the company.