How much a data set varies.
In short:
Variance is a statistical term used to describe the spread of data points within a data set. More plainly, variance says how far numbers in the data set are from the mean (average).
When used in the context of investing, investors look at variance to get an understanding of the price variably of an asset they are looking at, i.e. the volatility of the asset. However, variance is expressed as the square of the original units which is not ideal. To get to a more meaningful number, investors will often take the square root of the variance to arrive at the standard deviation which is in the same units as the data set.
Key Points
- Variance is the measure of the spread of values in a data set.
- Variance results in the squared values and units of the original data set, i.e., dollars2.
- The larger the variance the larger the spread and variability in your data set from the mean.
- In investing, the larger the variance the more volatility the asset has.
- Variance is often difficult to interpret.
In-depth:
What is variance
When looking at a set of data points it may be valuable to have an understanding of how much the data set spreads out from the average – which is variance. For example, if you were looking at a specific stock’s price data over a period of time, you may want to know how much the stock’s price varies from the average price over that time period.
Why is this valuable? Because having an understanding of the variability of the stock’s price over a period of time will give an investor sense of the volatility of the asset. The more volatility, the potential risk there is for the investor which may benefit or hinder their investing strategy.
While variance can give an indirect indication of this variability the main use of variance is to get to the standard deviation value which can be easily interpreted as the same unit figure of the original data’s units.
How to calculate Variance – Example
The calculation for variance may be slightly different based on the data you are working with, that is if your data is of a population or a sample from a population. In either calculation each number will be subtracted from the data’s mean then squared (to make positive), then the sum of all the squares will be divided by the number of values in the data set (if population) or the number of values in the data set minus 1 (if sample).
Generally, in an investing scenario, you will have a population data set.
Formula:
Population variance
To understand how to apply the variance formula we can look at an example calculation in a scenario.
Let’s say we’re looking at company AXPS‘s stock performance over the last 7 years. When go out and collect the annual returns for each year our data set is as follows.
Step 1:
AXPS: (year 1, 10%), (year 2, 14%), (year 3, 12%), (year 4, -7%), (year 5, 20%), (year 6, 17%), (year 7, 7%)
Step 2: Now that we have the data, we need to calculate the mean by summing the returns then dividing by 7.
10%+14%+12%+-7%+20%+17%+7% / 7 = 10.43%
Step 3: we need to subtract each value from the mean and square the result.
(10% – 10.43%)2 + (14% – 10.43%)2 + … + (7% – 10.43%)2 = 4.66%
Step 4: finally, we take the value we just calculated and divide by the number of values in our data set since we’re using a population.
4.66% / 7 = .67%. this value is our variance which admittedly isn’t very useful in this form.
Step 5: Turning the variance into the standard deviation, a useable form for interpretation.
(.67%)^(1/2) = 8.16%. the interpretation is that this stock has a variation of 8.16% from its mean.
Calculating Variance in Excel
While calculating the variance by hand may be useful to get an understanding of the mechanics of the formula, it is not realistic to do so in practice. Instead, we can use a prebuilt function in excel to automate the calculation for us and reduce the risk of human error.
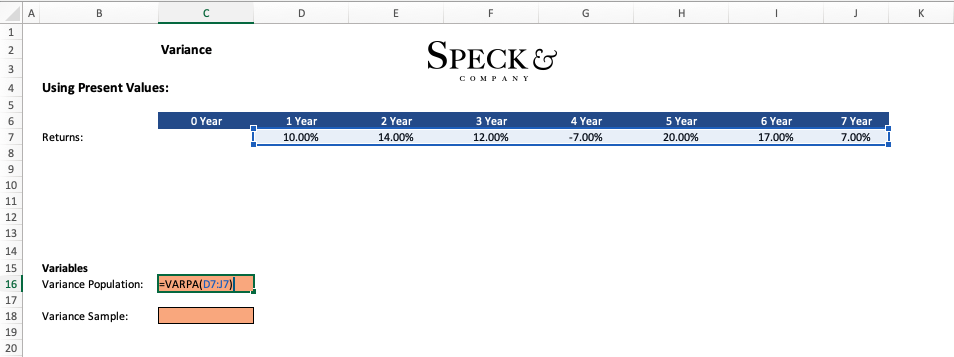
To perform the calculation for the variance for a population we can use the “=VARP” function in excel. If we were to apply this function to the same scenario we used above the result would be the same “.67%”.

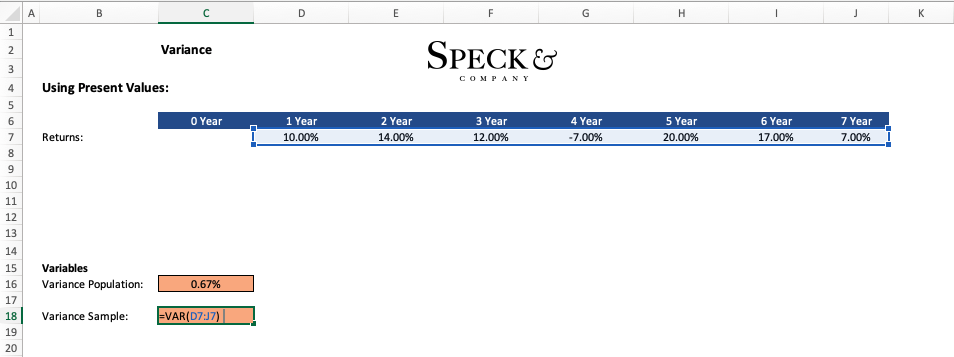
Now if we were calculating the variance of a sample of data we would need to use “ n-1” in the denominator to keep the calculation unbiased. To account for this in excel we use a different prebuilt function “=VAR” which will automatically do this for us. Note the change in the result to “.78%” which is large than that of the population variance.

Variance in stocks
The real use of variance by investors with respect to stocks is to calculate the standard deviation of a stock’s returns. While variance could give an initial idea of the volatility of a stock, simply taking the root of the variance will result in a much more usable value for the investor.
Portfolio Variance
Portfolio variance is a bit different to calculate than the approach we’ve taken above. Like the standard variance calculation, portfolio variance measures the spread of a portfolio’s returns.
The main difference is that with a portfolio we have many different assets which may hold different weightings and have different respective price movements. To account for this, we need to use a different formula that relies on having the individual variances for each stock or asset, their weighting, their correlation, and their covariances.
However, once we calculate a portfolio variance we can find the standard deviation to have an easily usable result
If you are interested in portfolio variance and its calculation, we suggest you check out the article on portfolio variance.