What is the Price-to-Earnings Ratio – The P/E Ratio
The P/E Ratio or Earnings Multiple is a measure of a company’s stock price relative to earnings
What is the P/E Ratio?
In short:
The P/E ratio of a given company relates the going price per share to its earnings per share to create a metric that can be used in relative valuation. This ratio gives a quick way to begin evaluating a company but only when it is compared to like type companies or to itself at different points in time. The calculation is simply done by dividing the current share price by the earnings per share.

In-depth:
There are commonly two flavors for the P/E ratio, one is trailing P/E and the other forward P/E. Both are an attempt to figure out the valuation for a company, that is whether or not the company is overvalued, valued fairly, or undervalued. The difference between the two lies in which earnings per share is used.
Trailing P/E
The trailing P/E is a gauge of what investors are willing to pay for a share given the company’s past performance. This is because the earnings per share used to calculate trailing P/E is the eps for the past twelve months, called the trailing twelve and denoted “(ttm)”.What should be noted is that companies only report earnings on a quarterly basis so it is possible to have some lag in this figure.
One reason an investor may prefer the trailing P/E is that it is based on actual earnings, these earnings have taken place and are not subject to someone’s estimation. Using actual earnings rather than expected earnings removes much of the risk of error and potentially making decisions off inaccurate numbers.

Forward P/E
Knowing what the company is valued at for what it has done in the past is valuable, however, what a company has done in the past is not as important to an investor as what it will do in the future. To accommodate for this some investors prefer to use the Forward P/E which is based on expected earnings called guidance.
Guidance is issued by companies or analysts detailing what they reasonably expect to earn going forward. Investors can then take this information and use it to calculate the forward P/E to help them decide what they are willing to pay to invest. The potential problem with using guidance to calculate Forward P/E comes in either with the unknown risk of future events and the possibility companies over or understate their future earnings. A company with a Forward P/E of say 25 could quickly go to a P/E of 35 or higher if an unforeseen event happens or the company did a bad job at estimating their earnings.
How to use the P/E Ratio?
As noted at the beginning of this article, P/E, both Forward and Trailing have no useful value in and of themselves. P/E is a relative valuation metric that only serves to indicate if a stock is potentially overvalued or undervalued relative to its peers.
High P/E Example
Looking at an example, a software company A may be trading at a trailing P/E of 39 while other software companies may only be trading for a trailing P/E of 29. In this scenario, you might think that company A is overvalued which it might be however another way to interpret this could be to ask why are investors willing to pay so much more for company A than other software companies. What could be possible is that the potential for earnings growth is significantly higher for company A than for the rest of the software companies. In this case, the premium paid for company A might be worth it.
The one thing that can be solidly taken away from the scenario above is that company A is trading at a premium level relative to peers, whether this premium is justified is up to the investor to figure out.
Low P/E Example
Looking for undervalued companies investors may seek to identify them by low P/E’s. Say a car manufacturer is trading for a trailing P/E of 10 while the other car manufacturers are trading around a P/E of 15. An investor may see this as an indication that the car manufacturer is undervalued which it could be. Another way to look at this would be to say maybe there is a reason the car manufacturer is trading below the P/E of other comparable companies. The company could be losing market share and its future expected earnings not as good.
In this scenario, the one thing that can be solidly taken away is that the car manufacturer is trading at a discount to the other car manufacturers. This discount once again may be justified or not but that is up to the investor to conclude.
Lastly, in both examples, the determination of value was relative to the other comparable companies. This assumption is that the market has priced the other companies correctly and that the companies are not already being overvalued or undervalued by the market.
Where to find P/E Ratio information?
Already calculated P/E ratios can easily be found on many online stock data sites, we’ve included a list of a few sites below.
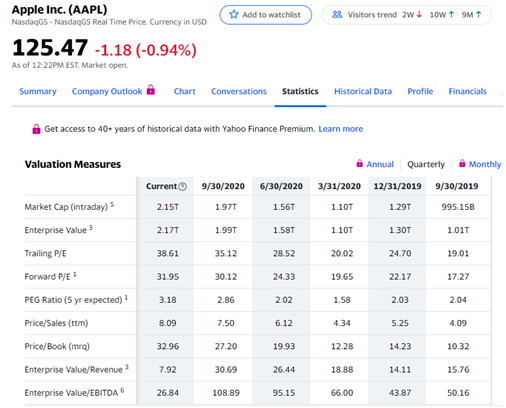
Simply visit one of these sites, enter a stock quote then look for “summary”, “key statistics” or something to that effect. You should see “PE (ttm)”, “Forward PE”, or “trailing PE”. The “(ttm)” means trailing twelve months, this indicates that the figure was calculated to include the most recent quarterly data.
Since P/E ratios are mainly used to help speed up and identify companies of interest, using already calculated information may be the best route of action. From identifying companies by the P/E ratio, a deeper analysis maybe wanted to be conducted by the investor.
Additional resources: What is the PEG Ratio?
PE Ratio FAQs
It depends, the PE ratio is a comparative metric, meaning a good PE ratio will depend on what the PE ratios are for other similar companies. PEs higher than others mean you are paying more per $1 of earnings, while lower is the reverse.
The PE ratio tells an investor how much they are paying for every $1 of earnings of a company. For example, a 25 PE means the investor is paying $25 for every $1 of earnings.
It depends. High PE ratios are common for high-growth companies who expect large earnings growth in the future. The PE should be used to compare one company with other similar companies.
The PE ratio tells an investor how much they are paying for every $1 of earnings of a company. Investors use the PE ratio to compare one company to other similar companies.