Measuring the relationship between two securities
In short:
Correlation is a statistical measure of the linear relationship between two sets of variables. In finance and investments, correlation can be used to measure the degree to which different securities move with the same directionality. The benefit of knowing the correlation of securities can be offsetting risk when constructing an investment portfolio.
More practically, if we know the prices of two different stocks over a period of time, we can see how much their share prices move together.
Key Points
- Correlation is a statistical measure of the linear relationship between two sets of variables.
- The correlation is expressed with the correlation coefficient that will be on a range from -1 to +1.
- If some form of correlation is expressed between variables, this does not necessarily indicate that a change in one will cause a change in the other.
- In Investing, correlation is a tool to measure the price relationship between different securities.
In-depth:
Value of Correlation in Finance
Correlation expresses the relationship strength between two variables through the correlation coefficient which ranges from -1 to +1. By measuring the correlation of two different stocks, bonds, indexes, or other securities an investor can select investments that either increase their concentration of assets that move similarly or offset the connectedness of their portfolio. This therefore can help an investor apply either a balancing strategy or concentration strategy to their total investment holdings.
To see how a possible investment is correlated with securities they already own an investor will look to the correlation coefficient. If the correlation coefficient of these securities is exactly 1, they are said to have a “perfectly positive correlation”. On the other hand, if the two investments have a correlation coefficient of -1, they are sad to have a “perfectly negative correlation”.
When the securities correlation coefficient falls above zero but below +1, there is a positive correlation where the decimal can be thought of as the “strength” of the correlation. Likewise, a correlation coefficient below zero but above -1, then there is a negative correlation with the “strength” once again represented by the decimal value. Zero represents no correlation.
Important note
When using correlation in finance to compare two securities, the timeframe you choose to compare between will have an impact on the correlation coefficient.
For example, if you are measuring the correlation using monthly prices over a year it is very likely you will have a different correlation coefficient than if you use daily prices over the same year. What should not change is the general relationship, meaning if you have a positive correlation, you will still have a positive correlation.
That said, extend out the timeframe of your data set from examining the correlation over a one month period to examining over a one year period the correlation general relationship could change in addition to the correlation coefficient.
Correlation Formula
Measuring Correlation of Stocks – Example Calculation
To understand how to apply the correlation formula we can look at an example calculation in a scenario where we compare two different stocks.
Let’s say that we have company AXP and company ABT whose average stock prices over the last six months are as follows.
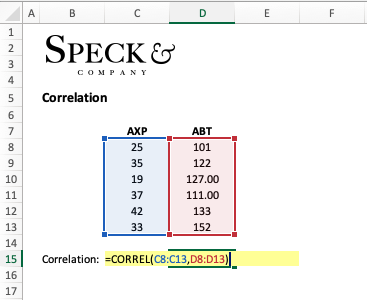
AXP (25, 35, 19, 37, 42, 33)
ABT (101, 122, 127, 111, 133, 152)
Step 1: At this point, we need to subtract each value in the respective data sets from the mean of the data sets.
Mean of AXP: 31.83
Mean of ABT: 124.33
Step 2: Now we subtract each value in the respective data sets from their respective means and multiply them.
Numerator: (25 – 31.83) (101 – 124.33) + (35 – 31.83) (122 – 124.33)+…+ (33 -31.83) (152 -124.33) = 169.33
Step 3: We can now work on the denominator by squaring the result of the individual variable minus the mean of the respective data set.
AXP (25 – 31.83)^2 + (35 – 31.83)^2 +…+ (33 -31.83)^2 = 352.83
ABT (101 – 124.33)^2 + (122 – 124.33)^2 +…+(152 -124.33)^2 = 1,575.33
Step 4: Still in the denominator we take these two values we just calculated, multiply them together then take their square root.
[ 352.83 x 1,575.33 ]^1/2
Step 5: we take our numerator and divide it by our denominator.
169.33 / 745.54 = .227 correlation value
Conclusion: Our conclusion is that these stocks have a weak positive correlation to one another based on the data we have available.
Calculating Correlation in Excel
While knowing how to calculate the correlation between two securities could be valuable to understand the mechanics behind the formula. Calculating correlation by hand is not practical and should not be done as it is tedious and susceptible to human error.
The best option when comparing data sets is to use Excel’s built-in “=CORREL” function which will quickly do all the computation for you. Applying the prebuilt excel “=CORREL” function to the scenario above, we arrive at the same value of “.227”.

Frequently Asked Questions
Correlation in the stock market is the statistical description of the relationship between the price movement of two different stocks. Simply put, correlation answers “do these stocks move together and to what degree do they move together”.
A good correlation between stocks will be based on your investment objective. If you want to diversify then you may look for stocks that have a perfectly negative correlation (value of -1). If you want to concentrate your investments so they move together you may want stocks with a perfectly positive correlation (value of +1).
A high stock correlation is where the correlation coefficient is either +1 or -1. This would indicate a perfect positive or perfect negative correlation. In reality, values of .8 or higher are a high positive correlation likewise values of -.8 or lower are high negative correlations.